
Annual Rainfall Graphs of the Past Five Years in South Africa: This guide is especially created for Grade 12 and Grade 11 Geography students who are busy with their Practical Research Tasks and need accurate, simplified data on rainfall trends. On this page, you will find a clear breakdown of annual rainfall patterns in South Africa from 2019 to 2024, supported by a graph that makes it easy to compare year by year.
Understanding rainfall patterns is a critical part of climatology in both Grade 11 and Grade 12 Geography. Whether you are studying the impact of drought, seasonal variations, or how climate influences land use, this data will help you back up your findings with real statistics.
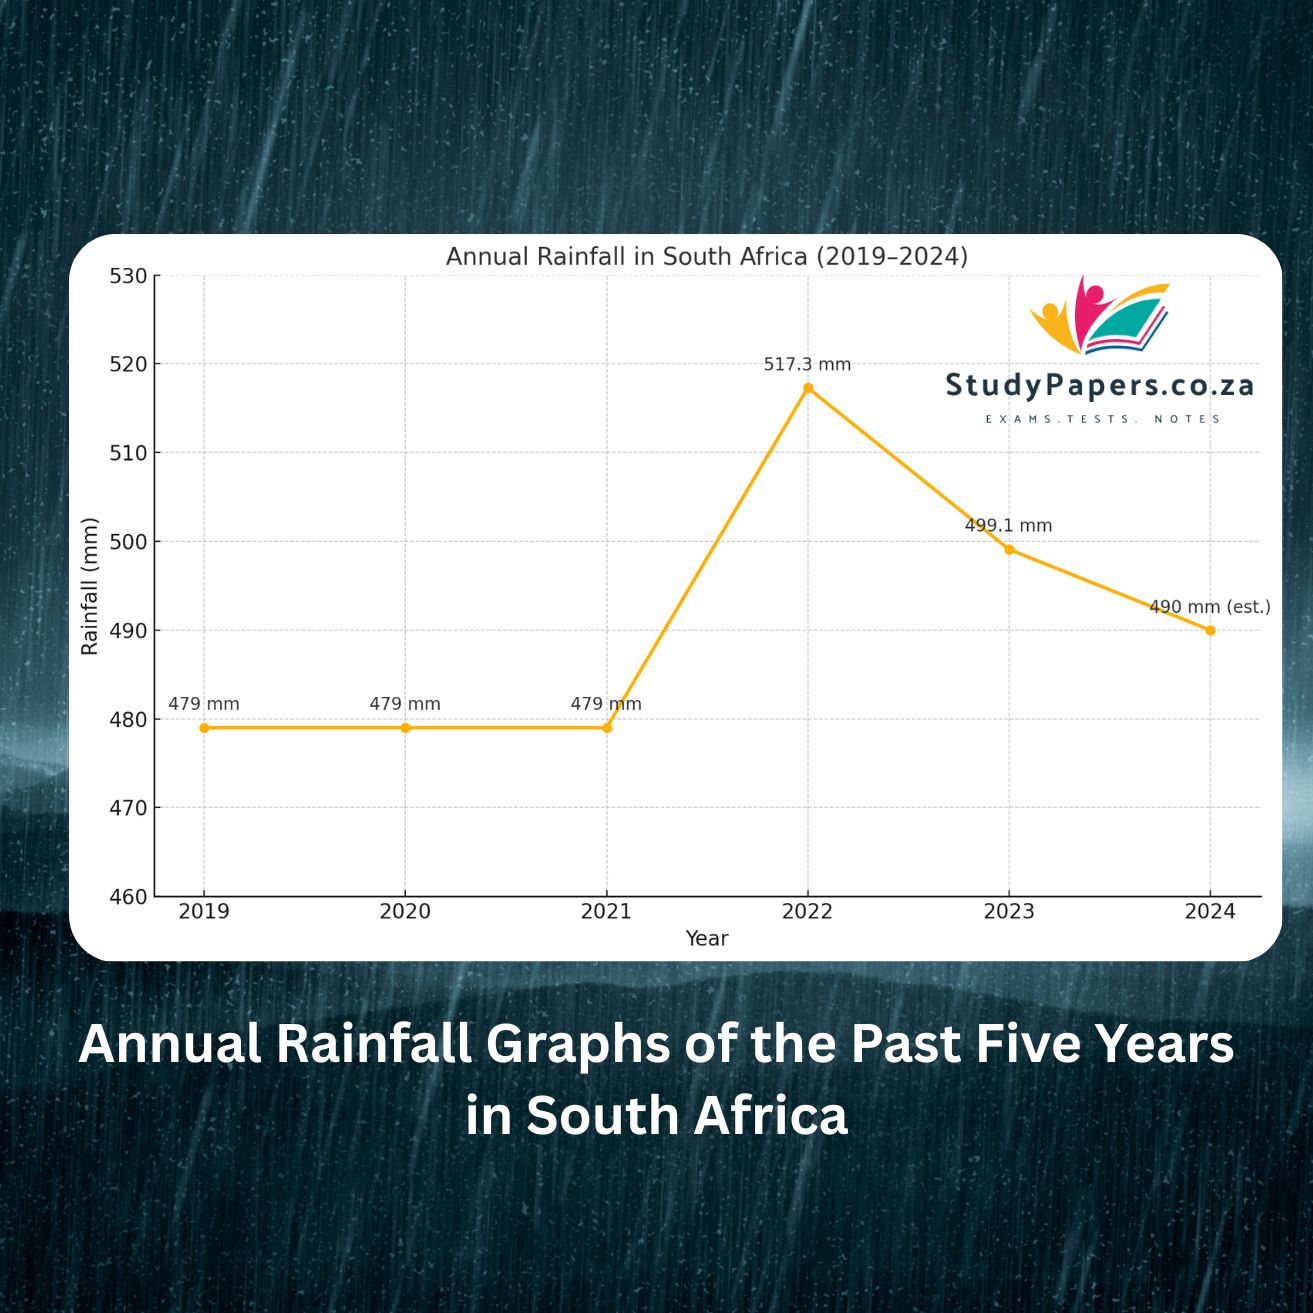
South Africa’s Rainfall Graph Trends: 2019 to 2024
From 2019 through to 2021, South Africa experienced average rainfall levels, staying close to the long-term mean of around 479 mm. However, this period was also affected by a regional drought, particularly visible in parts of the Eastern Cape and Northern Cape. Many dams remained low during these years, but overall national rainfall totals did not show sharp drops.
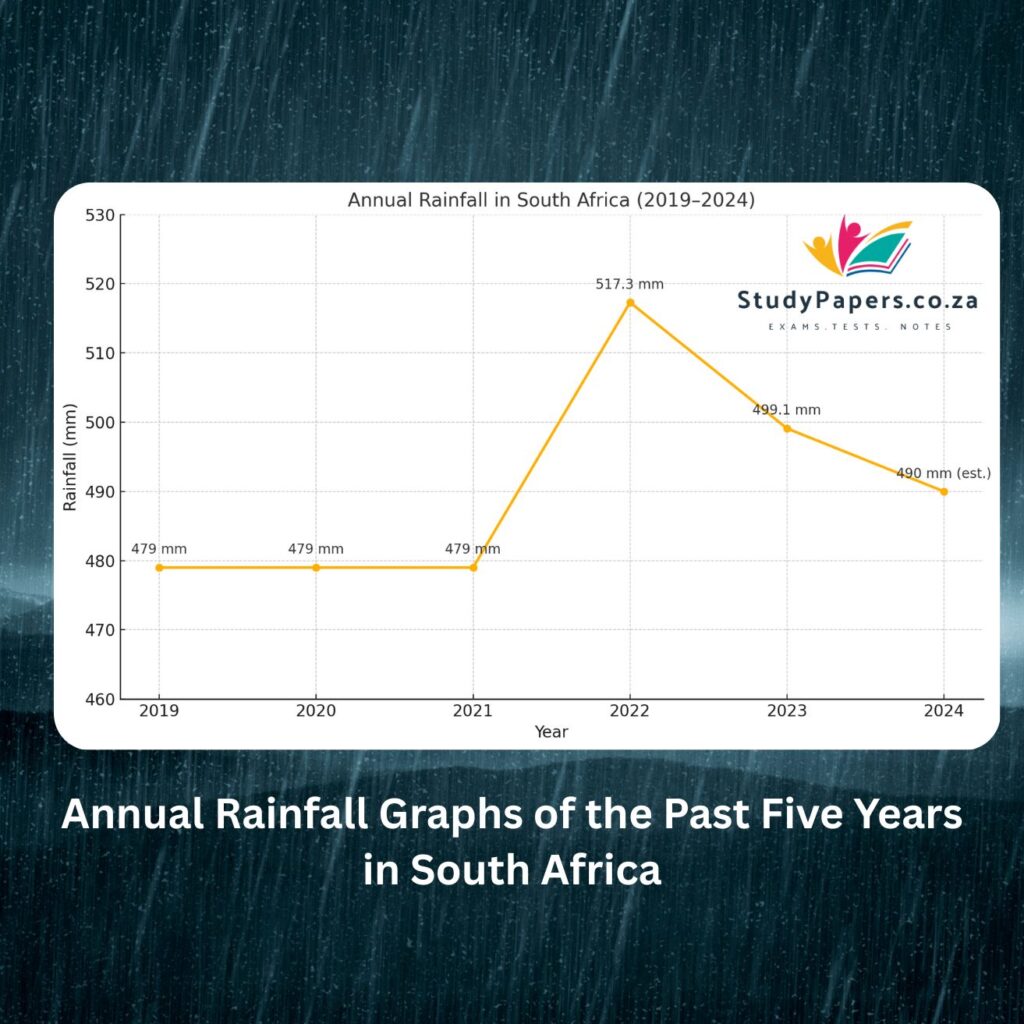
In 2022, the country experienced a much wetter-than-usual year, with the national average climbing to 517 mm. This increase was linked to La Niña conditions, which tend to bring more rain to southern Africa. Agricultural areas benefited from this upswing, and many provinces saw improved water security.
The year 2023 followed with rainfall at approximately 499 mm, slightly above the historical average. It was more balanced, without the extremes of drought or floods dominating the national picture.
2024, however, has presented a mixed picture. The early months of the year were influenced by El Niño conditions, which usually cause reduced rainfall and higher temperatures in southern Africa. Several provinces recorded dry spells, but this changed mid-year. In June 2024, a major storm system brought intense rainfall to central and eastern parts of the country. At the time of writing, a full-year total for 2024 is not yet available, but early estimates place it close to 490 mm.
Why This Is Useful for Your Geography Research Task
- You can use the graph from this data to complete your tasks that ask for climate analysis.
- You can compare the impact of El Niño and La Niña using the 2022 and 2024 records.
- You can link rainfall patterns to agriculture, drought, food security, or flooding in South Africa.
- This is a solid real-world example of long-term climate variability, which is a key CAPS requirement.
Use this resource as a factual base in your practical research project, and make sure to reference the graph included above when explaining trends and supporting your findings. If your teacher asks you to focus on climatic averages, anomalies, or events, this data is ready to be used.